
Conversion Rate Optimization
All social ad experts agree: 70% of a campaign’s success depends on the quality of its creatives.
When it comes to targeting, Google and Meta’s algorithms excel at finding the right audiences, even with less precise data than before (thank you, first-party data).
However, if your creatives are average, even the best algorithms won’t work miracles 🪄
In an ultra-competitive market where audiences are saturated, how can you know which ad will hit the mark and maximise your sales?
Together with Thomas from Butterfl.ai, we’re sharing 3 keys to analyse and boost the performance of your ads this holiday season 🗝️
🦋 Butterfl.ai: The data suite designed for e-commerce brands
butterfl.ai helps brands make strategic decisions without getting lost in Excel or Google Sheets.
Their tools provide valuable insights on crucial growth topics such as optimising the purchase journey, Klaviyo reporting, and persona behaviour analysis.
In this edition, Thomas gives us an exclusive look at their latest solution to measure, understand, and boost the performance of your social ad creatives. To learn more, you can contact Thomas directly 👈
🔬 Track your performance, creative by creative
Many marketers analyse their results at a high level, focusing only on campaigns or ad sets.
But to maximise your reach and connect with the right audience, the magic is in the details 🔎
A strong creative can get lost in an underperforming campaign, while a weak creative can derail your entire strategy.
Metrics like spend, CTR, conversion rates, and ROAS… every visual needs to be closely monitored 🧑🏼🔬
To analyse these metrics, you can take inspiration from We Are Jolies’ report in Meta Business Manager ⤵️
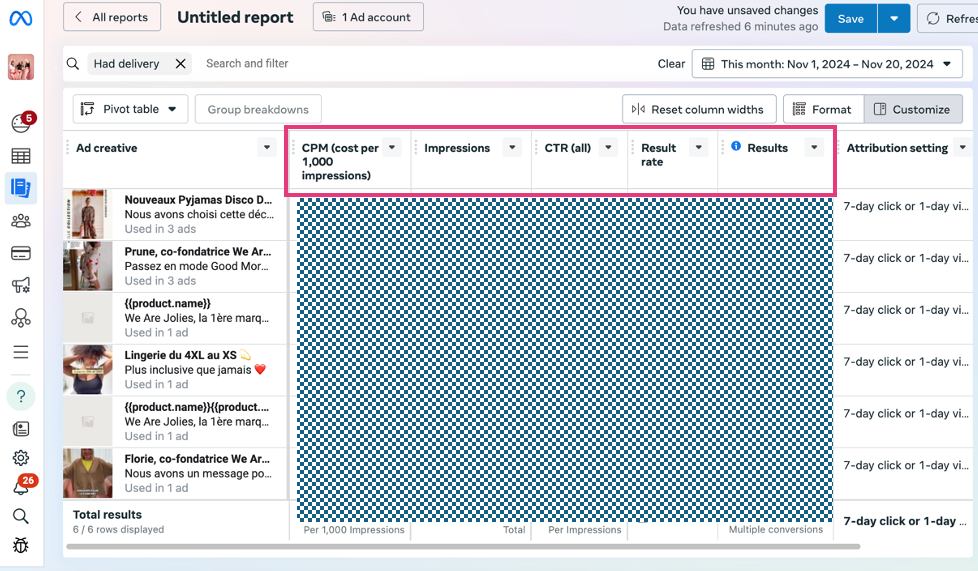
Here’s how to create a similar report:
- In your Meta Ads Manager, click on the Reports tab and customise your columns to include key metrics such as CPM, Impressions, CTR, Result Rate, and Results.
- Add the Ad Creative dimension to analyse performance by visual and activate the Pivot Table mode to organise your data clearly into columns.
- Filter your results by period and campaigns, then name your report something like: "Creative Performance Analysis - Holiday Campaigns 2024."
- Save the report so you can reuse it easily in the future.
🦋 Butterfl.ai’s latest feature to save you time
Let’s be honest: even with the best templates, Meta reports can be complex, and analysis can quickly become time-consuming.
To solve this, Butterfl.ai is launching a new feature: Creaboost 🚀
It helps you instantly identify your top-performing creatives and adjust your budget accordingly.
Set to launch in January 2025, Thomas is already sharing a sneak peek of how it works with We Are Jolies’ campaigns ⤵️
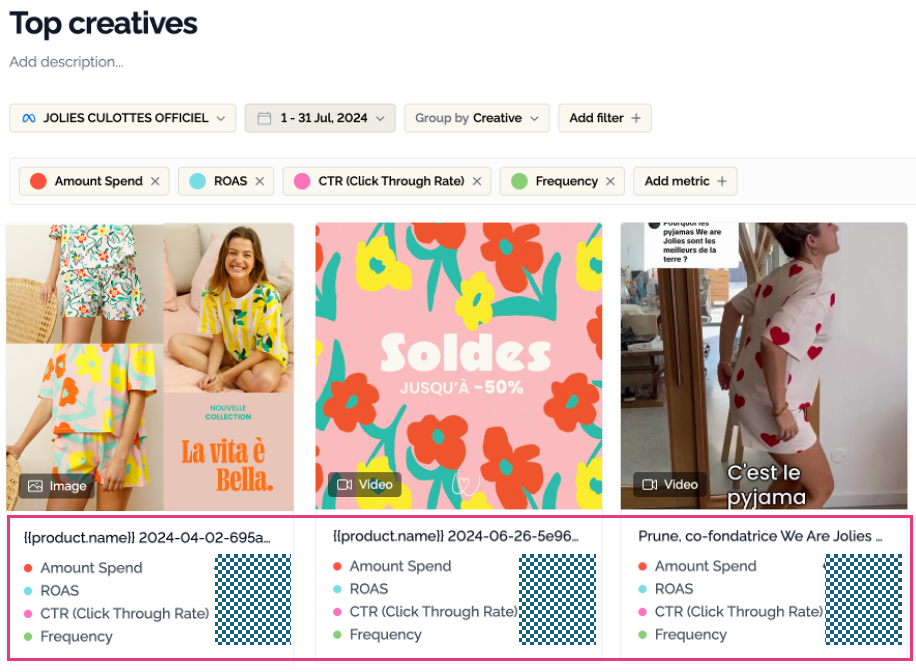
Want to chat with him about it? Click here 👈
✊ Winning creative + landing page combos
In December, your prospects have no time to waste.
Speaking as a consumer, nothing is more frustrating than clicking on an ad to learn more about a product… only to land on a homepage or catalogue page that doesn’t match what I was expecting 🙃
This is why aligning your landing pages with your creative’s promise is essential 🤝
Thomas recommends the following:
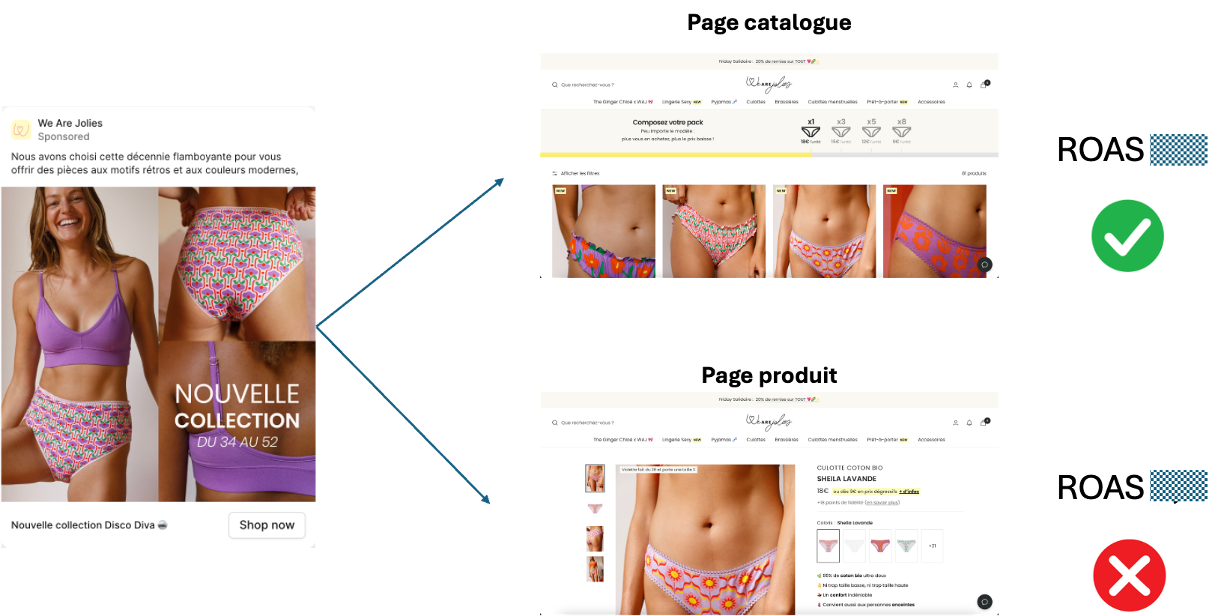
- Segment your landing pages based on your creatives: product pages, catalogue pages, homepages, blog articles, etc.
- A/B test your creative + landing page combos to identify the best converter and maximise your performance.
For example, the catalogue page delivered the best ROAS for this We Are Jolies ad showcasing multiple products ⤵️
💙 Optimise your post-purchase landing pages to keep your customers for life
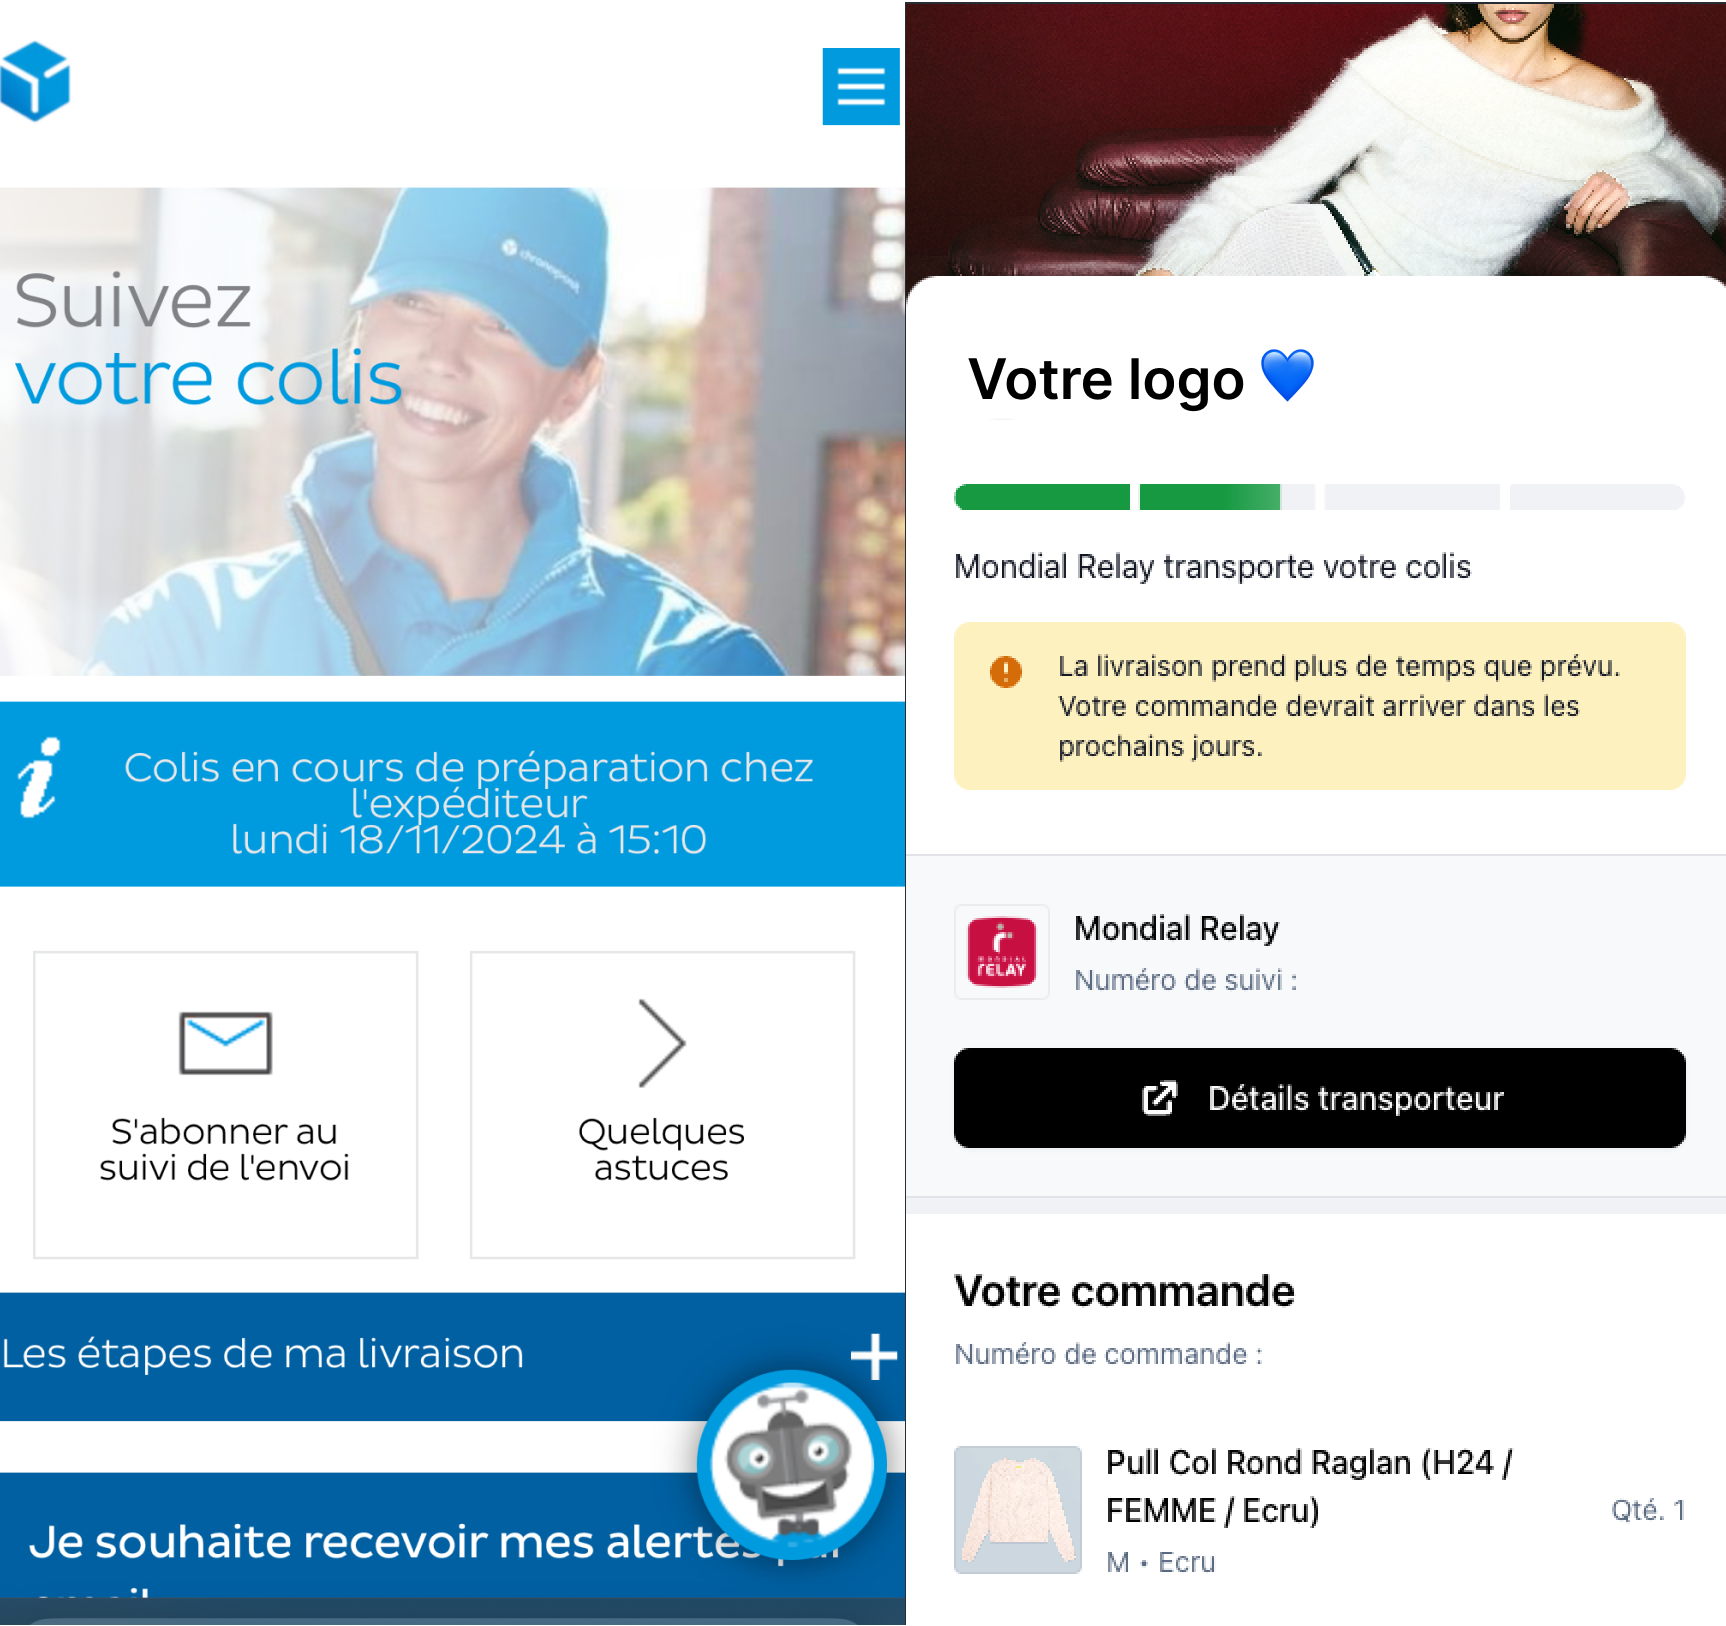
At Bigblue, if there’s a delay, customers are automatically notified by email, and their order status is updated in real-time on a dedicated tracking page.
And because a picture is worth a thousand words: on the left, my experience with a 4-day-delayed order. On the right, Bigblue’s transparent tracking ⤵️
😴 Watch out for creative fatigue
Like all good things, your creatives’ performance eventually comes to an end.
Creative fatigue is a common issue in paid social, especially during peak periods like the holidays.
The main warning signs include
- Decrease in CTR
- Increase in CPC
- Drop in ROAS
To check if your creatives are fatigued, you can build a scatter plot (yes, I just learned the term too 😉) like the one below, spotted by Thomas in this article.
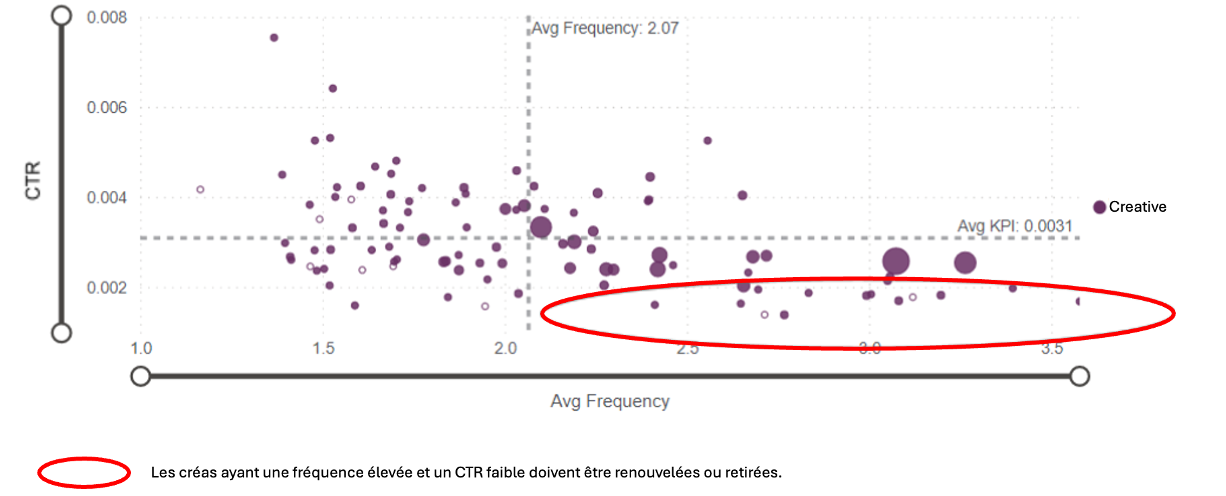
With some solid basics in Excel or Google Sheets, this type of chart allows you to:
Identify your high-performing creatives: Points with an average frequency and high CTR indicate creatives that capture attention and drive clicks.
Spot problematic creatives: Points in the high-frequency, low-CTR zone (highlighted in red) indicate overexposed ads that are no longer engaging and need to be refreshed or optimised.
📝 The prompt to ask ChatGPT to create a scatter plot
If you want to try, here’s the prompt I used to ask ChatGPT to guide me in creating a scatter plot for analysing my creatives:
"I want to create a scatter plot on Google Sheets titled 'Creative Performance Analysis: Frequency vs CTR.' On the X-axis, there should be the average frequency (Avg Frequency), on the Y-axis the CTR (Click-Through Rate), and the size of the points should reflect a KPI, such as budget or impressions. Add reference lines for the averages of frequency and CTR, and highlight critical areas, such as creatives with high frequency and low CTR. Guide me step by step."
- 🎟️ Update your marketing banners with your best promotions to grab attention and boost sales.
- 📦 Double-check your stock levels to avoid sell-outs and keep your customers happy.
- 💝 Perfect your unboxing experience to delight your customers (and their loved ones) when gifts are opened!
That’s it for this edition!
I hope these tips will help you optimise your paid social campaigns and maximise your ROAS.
To discover all of Butterfl.ai’s features and save time analysing your creatives, feel free to visit their website or contact Thomas directly on my behalf 🫶
New here?
This newsletter is brought to you by Bigblue, Europe’s #1 3PL. We’re at the heart of operations for 600+ brands, which lets us spot the best e-com trends out there. Every two weeks, we break one down for you.
I’m Evan. Before Bigblue, I built DOSE TUE: 244M organic views, 300K+ cans sold, 3K+ supermarkets, zero ad spend, all in one year. Now I break down what other great brands do so you can steal it, too.
.webp)


